Growth plan for Johnnie-O, 3 Oct 2026
Scale spend. Hold CAC.
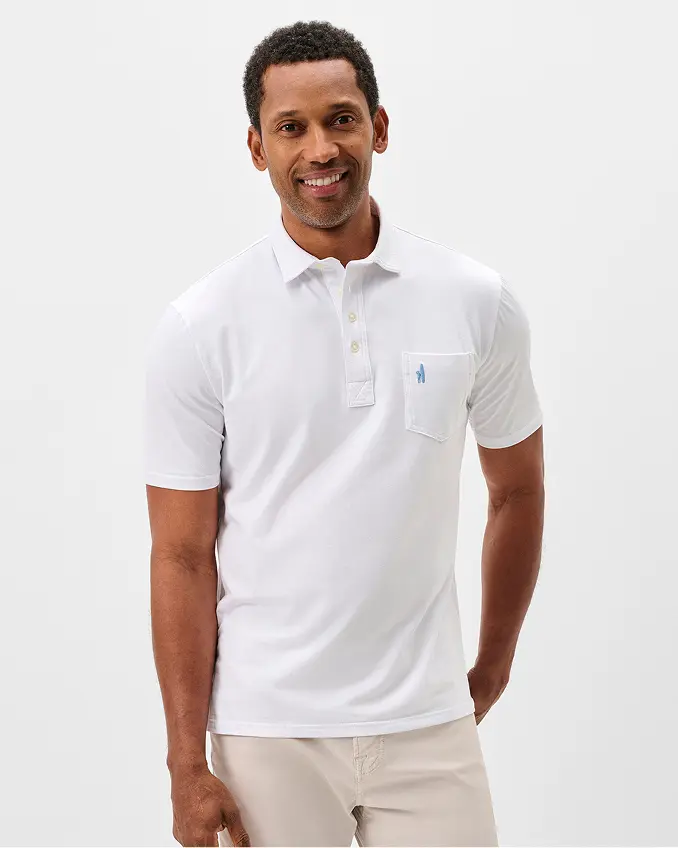
The plan protects one number: a target CAC of $64.80, set from a $135 average order. Johnnie-O already sells the Rally Cap Performance Polo at $135.00 in dozens of team versions. The work is making creative find the buyers who will pay it.
- Target CAC
- $64.80
- New ads a week at peak
- 20
- Creators live by week six
- 10
- Test spend, six weeks
- $24,000
Contents
10 chapters, then the gates and every number’s source.
01 The number
One number to protect: a $64.80 CAC on a $135 order
The one number is target CAC: $64.80. It is 0.6 of a $108.00 ceiling, which comes from a $135 average order, a 40% margin and one repeat order. Those inputs are guesses until your data replaces them. Every ad, creator and page gets judged against that line.
Protect
Target CAC: $64.80 on a first purchase
Ceiling = average order × margin × (1 + repeat orders): $135 × 40% × (1 + 1) = $108.00. Guard line = 0.6 × $108.00 = $64.80. Across the ranges: $9.45 to $537.30.
Three moves
- Launch ads in tests with one variable each, and kill losers early.
- Judge each creator video against the $64.80 line, not against views.
- Report daily CAC so any drift is caught inside one day.
- reviews on one rated page, 4.8 out of 5 stars
- 168
- Published
- nearly that many Happy Returns locations in the contiguous U.S.
- 8,000
- Published
- free shipping on all U.S. orders
- $150+
- Published
02 Variety
Dozens of team polos give every ad a different buyer
Each concept has to carry one reason to buy a Johnnie-O piece: the performance fabric that is lightweight, stretchy and moisture-wicking, the team on the chest, the West Coast prep look, or free returns. One concept, one reason, so a result means something.
| Reason to buy | Proof you already have | Ads (proposed) |
|---|---|---|
| UPF 50 performance fabric | Lightweight, stretchy, moisture-wicking, and UPF 50, our performance fabrics | 5 |
| Free U.S. shipping | Free Shipping on All U.S. Orders $150+ | 4 |
| Free, easy returns | free, easy, and environmentally friendly returns at nearly 8,000 locations in the contiguous U.S. | 3 |
| Your team, your style | All your favorite NFL, MLB, NHL, and NCAA teams on all your favorite styles. | 3 |
| Review score | 4.8 out of 5 stars. 168 reviews | 1 |
| Started from a car trunk | In 2005, John O’Donnell launched Johnnie-O selling polos out of the trunk of his car | 1 |
| Soft inside, sharp outside | this henley is secretly softer on the inside for the feeling of your favorite hoodie | 1 |
| Total | The ad concepts tab | 18 |
Each row is a reason to buy that the brand already has proof for. The count is how many of the ads carry it: a reason with a single ad is a bet, not a pattern, and the next batch of concepts moves toward the reasons that win.
03 Disturbances
Made-to-order embroidery and a $150+ shipping line are risks
| Disturbance | Likelihood | Impact | Owner | Gate (proposed) |
|---|---|---|---|---|
| Made-to-order embroidery takes 10-12 days, so custom pieces can disappoint buyers who expect fast delivery | High | Med | Your team | Custom pieces enter ads only when the 10-12 day wait is stated on the landing page. |
| Free shipping starts at $150+, and the $135.00 polo sits below it, so single-item carts may stall | Med | Med | Both | Single-item order CAC reported daily; pause that ad set if it passes $64.80. |
| Returns on $188.00 hoodies are unknown to me and could erase margin | Med | High | Your team | Return data by product shared in week one; pause any ad set whose returns exceed the agreed limit. |
| Team and league logos on polos may need approval before creators can show them in ads | Med | High | Your team | Claims and logo-use sheet signed off by your team before any team-polo ad goes live. |
| Creators miss the weekly video pace, so tests starve and the hook library stays thin | Med | Med | Me | Add creators only when the last two delivered; the ad batch waits if videos fall short of plan. |
| Hit rate comes in lower than assumed, so 20 concepts yield fewer than 2 winners | Med | High | Me | If week-three spend shows no concept at $64.80 CAC, rewrite the hook library before more spend. |
| Event tracking is incomplete, so CAC on polos and hoodies cannot be trusted | Med | High | Your team | Purchase events checked against order records in week one, before any budget scales. |
Scores are my read from outside the company, re-scored in week one with your data. Each risk has one owner and one gate that can be checked with a number, so nobody has to argue about whether it happened.
04 The ceiling
A $108.00 ceiling, and a guard line at $64.80
| Line | Value | Status |
|---|---|---|
| Average order | $135 (range $18.00–$398.00) | Assumption Range from the site product prices (Published); the midpoint is a guess |
| Gross margin | 40% (range 35–45%) | Assumption Replace in week one |
| Repeat orders after the first | 1 (range 0.5–2) | Assumption Replace with cohort data in week one |
| Margin per customer, all orders | $108.00 | Calculated Average order × margin × (1 + repeat orders) |
| Guard line for CAC | $64.80 | Calculated 0.6 × the margin per customer |
The math, with the assumed lines
Ceiling = average order × margin × (1 + repeat orders): $135 × 40% × (1 + 1) = $108.00. Guard line = 0.6 × $108.00 = $64.80. Across the ranges: $9.45 to $537.30.
Range across the assumptions: $9 to $537.
The $135 order and 40% margin are guesses; the $150+ shipping line and the $135.00 polo price are facts. Week one replaces the guesses with your order data, then the $108.00 ceiling moves.
The ceiling is a range, not one number: the most a new customer can cost before shipping and packaging, which I do not have. Replace the guessed lines with yours and every figure below recalculates.
05 Test ramp
$24,000 of tests over six weeks, from 12 ads to 20
| Week | New ads × budget / ad (proposed) | Weekly test spend | Cumulative | Creators posting | CAC target (proposed) |
|---|---|---|---|---|---|
| 1 | 12 × $250 | $3,000 | $3,000 | 0 | $65 |
| 2 | 12 × $250 | $3,000 | $6,000 | 2 | $65 |
| 3 | 12–20 × $250 | $4,000 | $10,000 | 4 | $65 |
| 4 | 12–20 × $250 | $4,000 | $14,000 | 6 | $65 |
| 5 | 20 × $250 | $5,000 | $19,000 | 8 | $65 |
| 6 | 20 × $250 | $5,000 | $24,000 | 10 | $65 |
Week 1 and Week 2 run 12 ads at $250 each, $3,000 a week. Weeks three and four run 12–20 ads, $4,000 a week. Weeks five and six run 20 ads, $5,000 a week, for $24,000 of tests in total. Proposed.
The math. Week 1: 12 × $250 = $3,000; Week 2: 12 × $250 = $3,000; Week 3: 16 × $250 = $4,000; Week 4: 16 × $250 = $4,000; Week 5: 20 × $250 = $5,000; Week 6: 20 × $250 = $5,000. Total $24,000 (96 ads × $250). A range such as 12–20 counts as its midpoint.
Weeks one and two test what the brand already has, rewritten per reason to buy. From week three, creator videos enter paid only after they beat their own account median. A range of new ads counts as its midpoint in the spend column.
06 Volume
More concepts, more winners: 20 concepts, 2 winners
More concepts means more shots at a winner. With 20 concepts the Assumption is 2 winners and $18,000 added monthly; with 80 concepts, 8 winners and $72,000. Hit rate and spend per winner are both guesses.
| Concepts tested / month | Hit rate (assumed) | New winners / month | Spend each winner holds (assumed) | Added spend at target CAC |
|---|---|---|---|---|
| 20 | 10% | 2 | $300 / day | $18,000 / month |
| 40 | 10% | 4 | $300 / day | $36,000 / month |
| 60 | 10% | 6 | $300 / day | $54,000 / month |
| 80 | 10% | 8 | $300 / day | $72,000 / month |
The math. 20 concepts × 10% = 2 winners × $300 × 30 days = $18,000 a month; 40 concepts × 10% = 4 winners × $300 × 30 days = $36,000 a month; 60 concepts × 10% = 6 winners × $300 × 30 days = $54,000 a month; 80 concepts × 10% = 8 winners × $300 × 30 days = $72,000 a month.
The hit rate and the spend each winner holds are placeholders. The first thirty days of tests replace them with real numbers, and the table is recalculated the same day.
07 Allocation
$100,000 split so tests come before scale
- Test ramp across polos, hoodies and pullovers
- $25,000
- 25%
- Scaling winners that hold target CAC
- $50,000
- 50%
- Creator pay and bonuses
- $15,000
- 15%
- Landing pages and tracking fixes
- $10,000
- 10%
Of the $100,000 to allocate, tests come first and scale follows only what holds target CAC. These splits are Proposed and move with week-one data.
The math. 25% × $100,000 = $25,000; 50% × $100,000 = $50,000; 15% × $100,000 = $15,000; 10% × $100,000 = $10,000. Sum 100% = $100,000.
This split is a proposal. It moves toward scaling as winners prove out, and toward testing when fatigue shows.
08 Channels
Meta first, because team polos at $135.00 need an audience
| Channel | Open when (proposed) | Why wait |
|---|---|---|
| Meta (Facebook and Instagram) | Week 1: it is where tests and creator videos launch | Team polos and golf shirts need to be seen before they are searched for |
| TikTok | When creator videos clear target CAC on Meta | Creator-led video fits golf and college-game content |
| Google Search | When team-polo ads show demand for named schools | Buyers who already want a school or team polo can search for it by name |
| Email and SMS | When first-order buyers exist to reach again | Repeat orders sit inside the $108.00 ceiling, so the second purchase matters |
| Johnnie-O Retail Stores | After online results are read and store traffic can be tracked | Returns can be dropped at a Johnnie-O Retail Store, so stores already touch online buyers |
A channel opens when its condition is true, not when the calendar says so. Until then the budget stays where the CAC is earned.
09 Payback
Payback decides: a $65 CAC pays back after repeat orders
Payback is the real constraint. At a $30 CAC the first order pays back with $78.00 left. At $65 it pays back after repeat orders, with $43.00 left. At $120 or $150 it never does, so I stop. Revenue growth means nothing if the order never covers its cost.
Cumulative margin per customer, order by order, before CAC: $54.00, $108.00.
| CAC (scenario) | First-order margin | Year-one margin | Left after CAC | Payback |
|---|---|---|---|---|
| $30 | $54.00 | $108.00 | $78.00 | First order |
| $65 | $54.00 | $108.00 | $43.00 | After repeat orders |
| $120 | $54.00 | $108.00 | −$12.00 | Never: stop |
| $150 | $54.00 | $108.00 | −$42.00 | Never: stop |
The math. CAC $30: $108.00 − $30 = $78.00 left; pays back: First order; CAC $65: $108.00 − $65 = $43.00 left; pays back: After repeat orders; CAC $120: $108.00 − $120 = −$12.00 left; pays back: Never: stop; CAC $150: $108.00 − $150 = −$42.00 left; pays back: Never: stop.
Read each row left to right: the margin of the first purchase, the margin over the whole horizon, what is left after CAC, and the purchase on which the CAC is earned back. A scenario that never pays back is a stop, not a test.
10 Scope
What I cover for Johnnie-O and what stays with your team
Covers
- Meta ad creative, testing and daily CAC reporting
- Creator briefs and a hook library for polos, hoodies and pullovers
- Landing page briefs built around the Rally Cap Performance Polo
- Weekly learnings and monthly cohort payback reports
Doesn’t
- Event tracking build; I spec it, your team implements it
- Product, pricing, licensing and logo approvals
- Fulfillment, returns handling and customer service
- Fabric, fit and sizing claims; your team signs off the claims sheet
What this plan covers is what I can change inside the ad account and the creator program. Everything outside it is named on the right so nobody assumes it is handled.
Gates, written before spend, so stopping isn’t a negotiation.
| Day | Keep going if (proposed) | Stop or change if |
|---|---|---|
| Day 14 | Twelve ads live each week, CAC readable on every one, and at least one concept close to $64.80. | Tracking cannot match orders to ads, or no concept gets within reach of $64.80. |
| Day 30 | Creators live match the plan, and a winner holds CAC at or under $64.80 for a full week. | No concept at or under $64.80 after four weeks of tests. |
| Day 60 | Blended CAC stays at or under $64.80 while spend rises, and payback shows on first orders or repeats. | CAC above $108.00 on scaled spend, or payback that never arrives. |
| Day 90 | Monthly cohort payback holds and spend scales toward the $100,000 budget at target CAC. | Cohort payback misses the repeat-order case; spend returns to the last level that held. |
Each gate is checked on its day with the numbers in the daily and weekly reports. If the stop condition is true, the spend stops and nothing renews until we talk.
What exists, what’s missing, and the order that’s forced.
| Piece | Exists today | Missing | Forced order |
|---|---|---|---|
| creative | Rally Cap Performance Polo in dozens of team versions at $135.00 | A hook library built one variable per test | 1st |
| claims sheet | Fabric copy: lightweight, stretchy, moisture-wicking | Signed-off claims and logo-use rules | 1st |
| creators | Golf, college and travel looks across polos and the Luxe Dopp Kit | A creator roster and briefs | 2nd |
| landing pages | Free shipping at $150+ and free Happy Returns | Pages that carry both offers beside the price | 2nd |
| reporting | $18.00 to $398.00 price range to segment CAC by | Event tracking spec and a daily CAC view | Week 1 |
The order is forced on purpose: creative and creators come first because they are what moves CAC, and everything else waits for that data.
Every number, and where it came from.
| Figure | Where it came from | Type |
|---|---|---|
| 168 reviews on one rated page, 4.8 out of 5 stars | https://www.johnnie-o.com/collections/our-top-picks | Fact |
| 8,000 nearly that many Happy Returns locations in the contiguous U.S. | https://www.johnnie-o.com/pages/faqs-new-icon | Fact |
| $150+ free shipping on all U.S. orders | https://www.johnnie-o.com/ | Fact |
| Product prices $18.00–$398.00 | product prices in the site product data (145 products), read 2026-10-03 | Fact |
| $135 average order · 40% margin · 1 repeat order | Placeholders, replaced in week one | Assumed |
| $64.80 target CAC | 0.6 of the $108.00 margin per customer | Calculated |
| $108.00 margin per customer | Price × (margin − discount), summed over the orders | Calculated |
| $24,000 of tests (96 ads × $250) | Danilo’s plan, matches Month one | Calculated |
| 0→10 creators in 6 weeks · 7 videos per creator a week | Danilo’s plan, matches Month one and the Creator engine | Proposed |
| $100,000 first budget split 25% / 50% / 15% / 10% | Danilo’s plan, re-set with the team in week one | Calculated |
| 10% hit rate · $300 a day per winner | Placeholders, replaced by the first 30 days of tests | Assumed |
| 303 creator videos a month at 10 creators | 10 creators × 7 videos a week × 52 ÷ 12 | Calculated |
| $5.74 per 1,000 views against a $1 target | Creator cost over the views the assumptions give | Calculated |
| $1,000 base pay · $50 bonus past 100,000 views | Danilo’s plan | Proposed |
| 1,500 median views · 4% breakout (10×) · 0.5% viral (750,000) | Placeholders, replaced by the first month of posts | Assumed |
| Pay bands $300–$600, $500–$1,000, $800–$1,500 | Danilo’s plan | Proposed |
Every figure on this page is listed here with where it came from. Fact means read on the site. Assumed and Proposed are Danilo’s own numbers, to be replaced in week one. Calculated is plain arithmetic on those, with the formula shown next to it.
Month one is where it starts.
In week one I get your order value, margin and return data, check purchase tracking, and write the first twelve ads around the Rally Cap Performance Polo and the Original 4-Button Polo. Two tests launch; the first creators come on right after.